Authors:
(1) Anees Baqir, Ca’ Foscari University of Venice, Italy;
(2) Alessandro Galeazzi, Ca’ Foscari University of Venice, Italy;
(3) Fabiana Zollo, Ca’ Foscari University of Venice, Italy and The New Institute Centre for Environmental Humanities, Italy.
Table of Links
- Abstract and Intro
- Materials and Methods
- Results and Discussion
- Conclusions and References
- Supplementary Information
2. Materials and Methods
Data collection and processing
The data was collected using the official Twitter API for academic research [1], freely available for academics at the time of collection. Based on the list of accounts retrieved from the NewsGuard dataset (see Table 1), we downloaded the Twitter timelines of media sources based in Italy, Germany, France, and the UK over three years from 2019 to 2021. NewsGuard is a tool that evaluates the reliability of news outlets based on nine journalistic criteria. Following such criteria, a team of professional and independent journalists assigns a “trust score” between 0 and 100 to each news outlet. Ratings are not provided for individuals, satirical content, or social media platforms like Twitter, Facebook, and YouTube. News sources are categorized into two groups based on their score: Reliable (trust score greater or equal to 60) and Questionable (trust score less than 60). The threshold is set by NewsGuard based on the evaluation criteria.
We collected only publicly available content from public Twitter accounts. The dataset included all the tweets published by the selected accounts in the period from 01 January 2019 to 11 November 2021, resulting in 25+ Million tweets. Table 2 reports the breakdown of the data. The percentage of posts by each country contributing to the total amount is shown in parentheses.
To ensure that our analysis concentrated on topics debated at the European level for cross-country comparisons, we applied keyword filters to our original dataset. We divided our dataset into three oneyear segments and filtered each segment according to a list of keywords related to the most discussed topic at the European level for that year. The statistics for the filtered data can be found in Table 3.


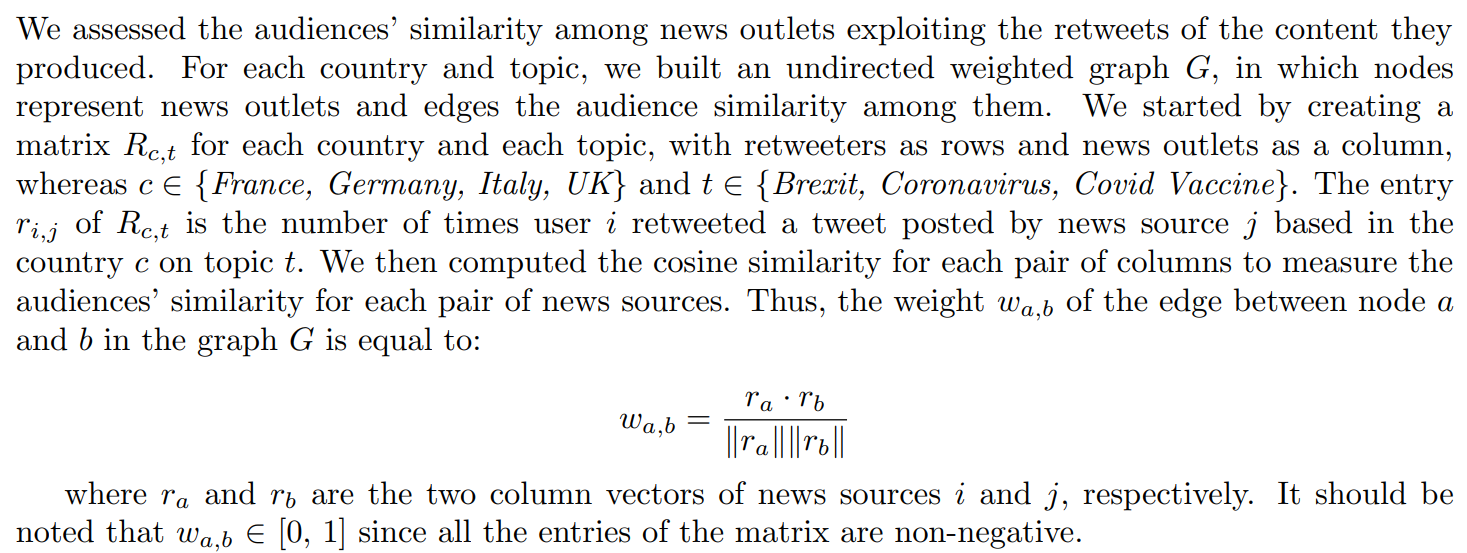
For the tweets in the filtered dataset, we collected all retweets. Details about the number of original tweets and retweets for each topic can be found in Table 3.

Similarity networks

Finally, we excluded all the 0-degree nodes and deleted all the edges with a weight below the median of all edge weights. This approach enabled us to capture the strongest similarities among news outlets’ audiences related to the selected topics within the European context.
Topic modeling
We utilized BERTopic, a topic modeling tool that extracts latent topics from a collection of documents, to identify the heated topics prevalent in all the countries under examination. BERTopic is a top2vec model generalized for pretrained sentence transformers (Grootendorst, 2022) that has recently demonstrated promising results in various tasks. BERTopic generates coherent clusters of documents through three steps: 1) extracting document embeddings; 2) clustering embeddings; 3) creating topic representations using class-based TF-IDF (Sammut and Webb, 2011) (c-TF-IDF). In the first step, any pre-trained transformer-based language models can be utilized, allowing the use of state-of-theart embedding techniques. The second step employs uniform manifold approximation and projection (UMAP) to reduce the dimension of embeddings (McInnes et al., 2018), and hierarchical density-based spatial clustering of applications with Noise (HDBSCAN) to generate semantically similar clusters of documents (McInnes et al., 2017). One of the topics is set to be ‘others’, and includes the documents that are not included in different topics.
This paper is available on arxiv under CC 4.0 license.
[1] https://developer.twitter.com/en/docs/twitter-api

